
Account-level product analytics becomes useful when product events and company context share a stable account identity. Map a few company fields to that account, keep missing values explicit, and distinguish the first-known segment from the current segment. Then you can compare account activation without counting seats as companies or rewriting your historical cohorts.
Which identity should your charts use?
Use the account or workspace ID your application already assigns.
Two users in one workspace should count as one account for account activation. A user switching workspaces should generate events against the workspace actually used. Neither an email domain nor a person's analytics ID can replace that association reliably.
PostHog group analytics and Mixpanel group analytics support analysis around group identities and properties. Use your tool's current setup and event-association instructions; this article defines the mapping to implement, not a native EnrichLoops analytics connector.
What should the account-field map contain?
Start with fields that support a question someone will actually answer.
These destination names are your application's proposed fields, not new EnrichLoops response keys.
| Destination field | Source or rule | Missing-value treatment |
|---|---|---|
| account_id | Your durable workspace/account ID | Do not publish an account-level update without it. |
| company_industry | Completed result's primary_industry | Use Unknown when absent; preserve the original label. |
| employee_count | Completed result's employee_count | Keep null or invalid values separate from numeric counts. |
| headcount_band | Your versioned banding rule | Use Unknown for missing or unusable counts. |
| company_hq_country | Completed result's headquarters country, when present | Do not call it the user's location. |
| company_received_at | When your workflow stored this result | Observation/retrieval time, not a freshness guarantee. |
| enrichment_state | Your task/result handling | Pending, matched, incomplete, or unmatched as appropriate. |
The company result documentation describes the available fields. Preserve the raw count and industry so you can revise a reporting rule without submitting another paid lookup.
How should headcount bands work?
Choose fixed, mutually exclusive bands and give unknown values their own bucket.
An illustrative policy uses 1-9, 10-49, 50-199, 200-999, and 1,000+. These are reporting choices, not universal market definitions. Zero, negative, unparseable, and missing counts should not automatically become the smallest segment.
If the source returns an employee range instead of a usable exact count, preserve that range. Decide explicitly whether it maps to one of your bands; do not invent a midpoint and present it as an observed headcount.
How do you preserve the meaning of a signup cohort?
Store a first-known observation separately from mutable current properties.
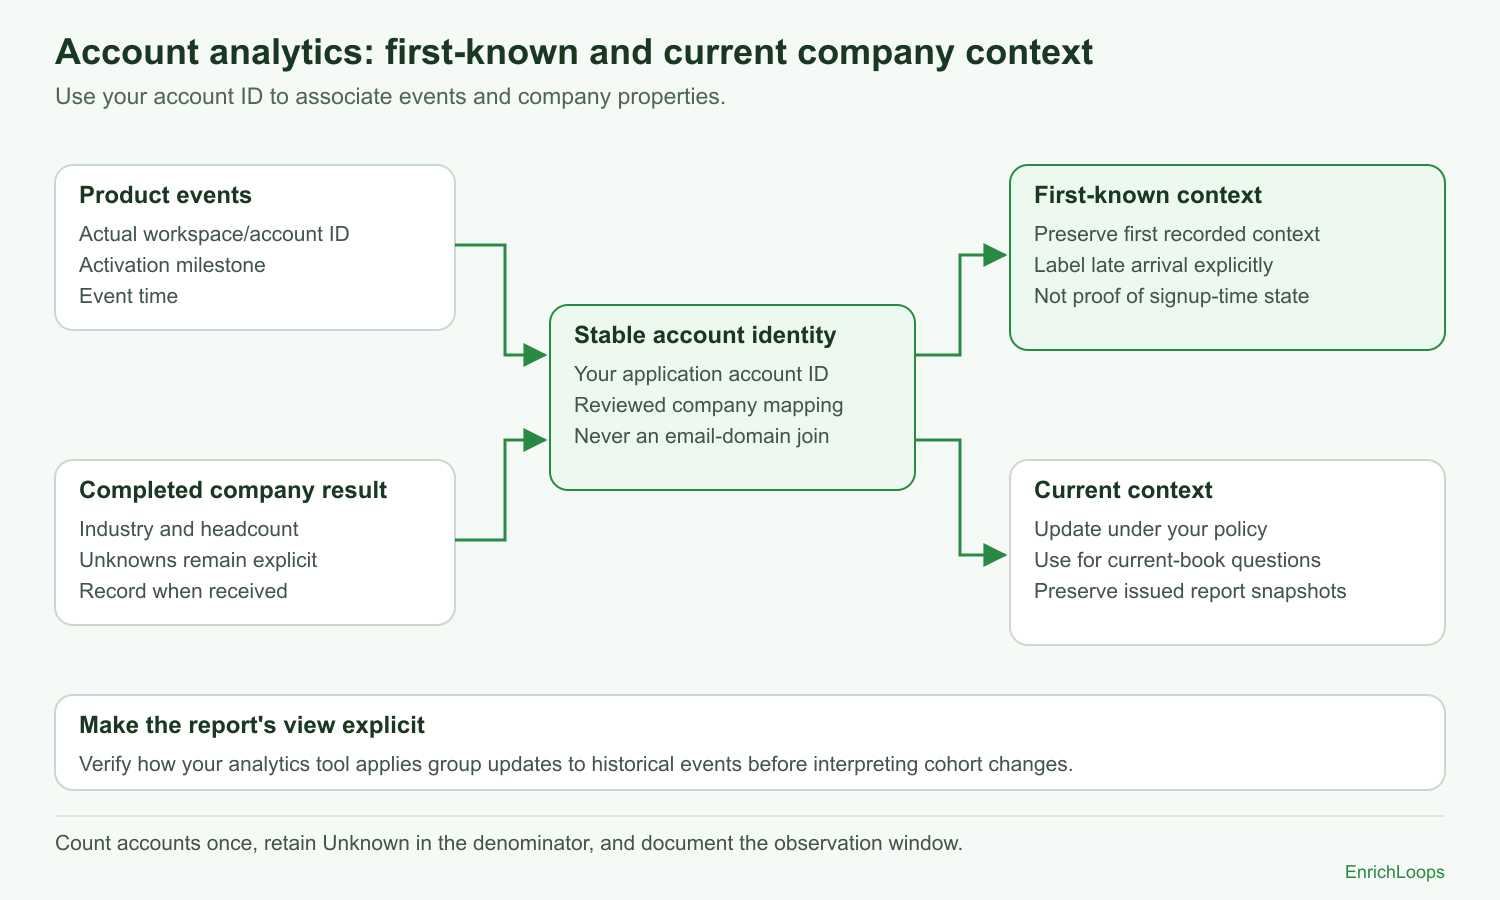 Account analytics mapping: events use a stable account ID, while company context is stored in separate first-known and current views.
If enrichment arrives after signup, call the snapshot first-known company context and record when it arrived. It is not proof of the company's state at the exact signup time.
For historical questions, preserve the context used by the event or reporting snapshot. For current customer segmentation, update current properties under your chosen policy. Do not retroactively label early no-data events as if they contained a result that arrived later.
Test how your analytics tool applies group updates to past events. The report should say which view it uses before anyone interprets a segment shift.
What should a first activation report show?
Show account counts, activated accounts, and unknowns with one consistent cohort window.
The following is an illustrative cohort in which all 40 accounts completed the same seven-day observation period. “Activated” means one account completed your chosen milestone, counted once.
| First-known headcount band | Accounts | Activated accounts | Activation rate |
|---|---|---|---|
| 1-9 | 10 | 2 | 20% |
| 10-49 | 10 | 4 | 40% |
| 50-199 | 10 | 5 | 50% |
| Unknown | 10 | 1 | 10% |
| Total | 40 | 12 | 30% |
Dropping Unknown would report 11 activated out of 30 known accounts, or 36.7%, while the entire cohort activated at 30%. Both calculations can be described accurately, but they answer different questions.
This small example is not enough to conclude that company size causes activation. Check sample size, product variant, acquisition source, and the definition of the milestone before changing your onboarding.
What should pass before you trust the dashboard?
Verify identity, denominator, and time behavior with a small test workspace.
Create a test account with two members, produce the activation event twice, and confirm it counts as one activated account. Add an unmatched account and check that it remains in the denominator. Change a company's current band and confirm the first-known cohort view stays unchanged.
Also test an event received before enrichment, a user switching workspaces, and a retry of the same account update. Your application should associate each update with the intended account and avoid inventing historical context.
Use the task flow to supply completed company results. Your application handles storage and analytics updates.
Evaluate company context on a small account sample, then verify the mapping before applying it to your dashboards.